Latest DLD sales
1,452
Recorded in أكتوبر 2026.
تحليل مدعوم ببيانات DLD
إشارات سوق مدعومة ببيانات DLD وسجلات مشاريع عامة لمستثمري عقارات دبي
Latest DLD sales
1,452
Recorded in أكتوبر 2026.
Transaction volume
AED 2.9 مليار
Dubai-wide sales volume from the latest DLD market period.
Median AED/sqft
AED 1,623
Market pricing signal from transaction rollups, not an asking-price forecast.
Market Signal
This section uses the same DLD-derived rollups as the main market pulse page. It is a market context layer, not a prediction engine.
Measured areas
84
All-time transactions
251,024
Overall AED/sqft
AED 1,995
Research Method
Area Momentum
Areas are ordered by year-on-year price movement from the market endpoint. Values are shown only when a rollup exists.
| Area | Transactions | Median AED/sqft | YoY price |
|---|---|---|---|
| Falcon City | 209 | AED 1,595 | +110.6% |
| Nad Al Sheba | 1,937 | AED 2,240 | +56.3% |
| Meydan | 1,924 | AED 2,261 | +53.8% |
| Difc | 715 | AED 3,731 | +45% |
| Jebel Ali | 125 | AED 350 | +41.2% |
| Al Barsha | 59 | AED 1,800 | +40.7% |
Price History
The appreciation summary comes from the public transaction price-history endpoint. It is historical context, not a forward return guarantee.
+70.8%
2020 to 2026
Project Records
These cards are pulled from the public project catalog and price rollup fields. They are not ranked, scored, or forecasted.
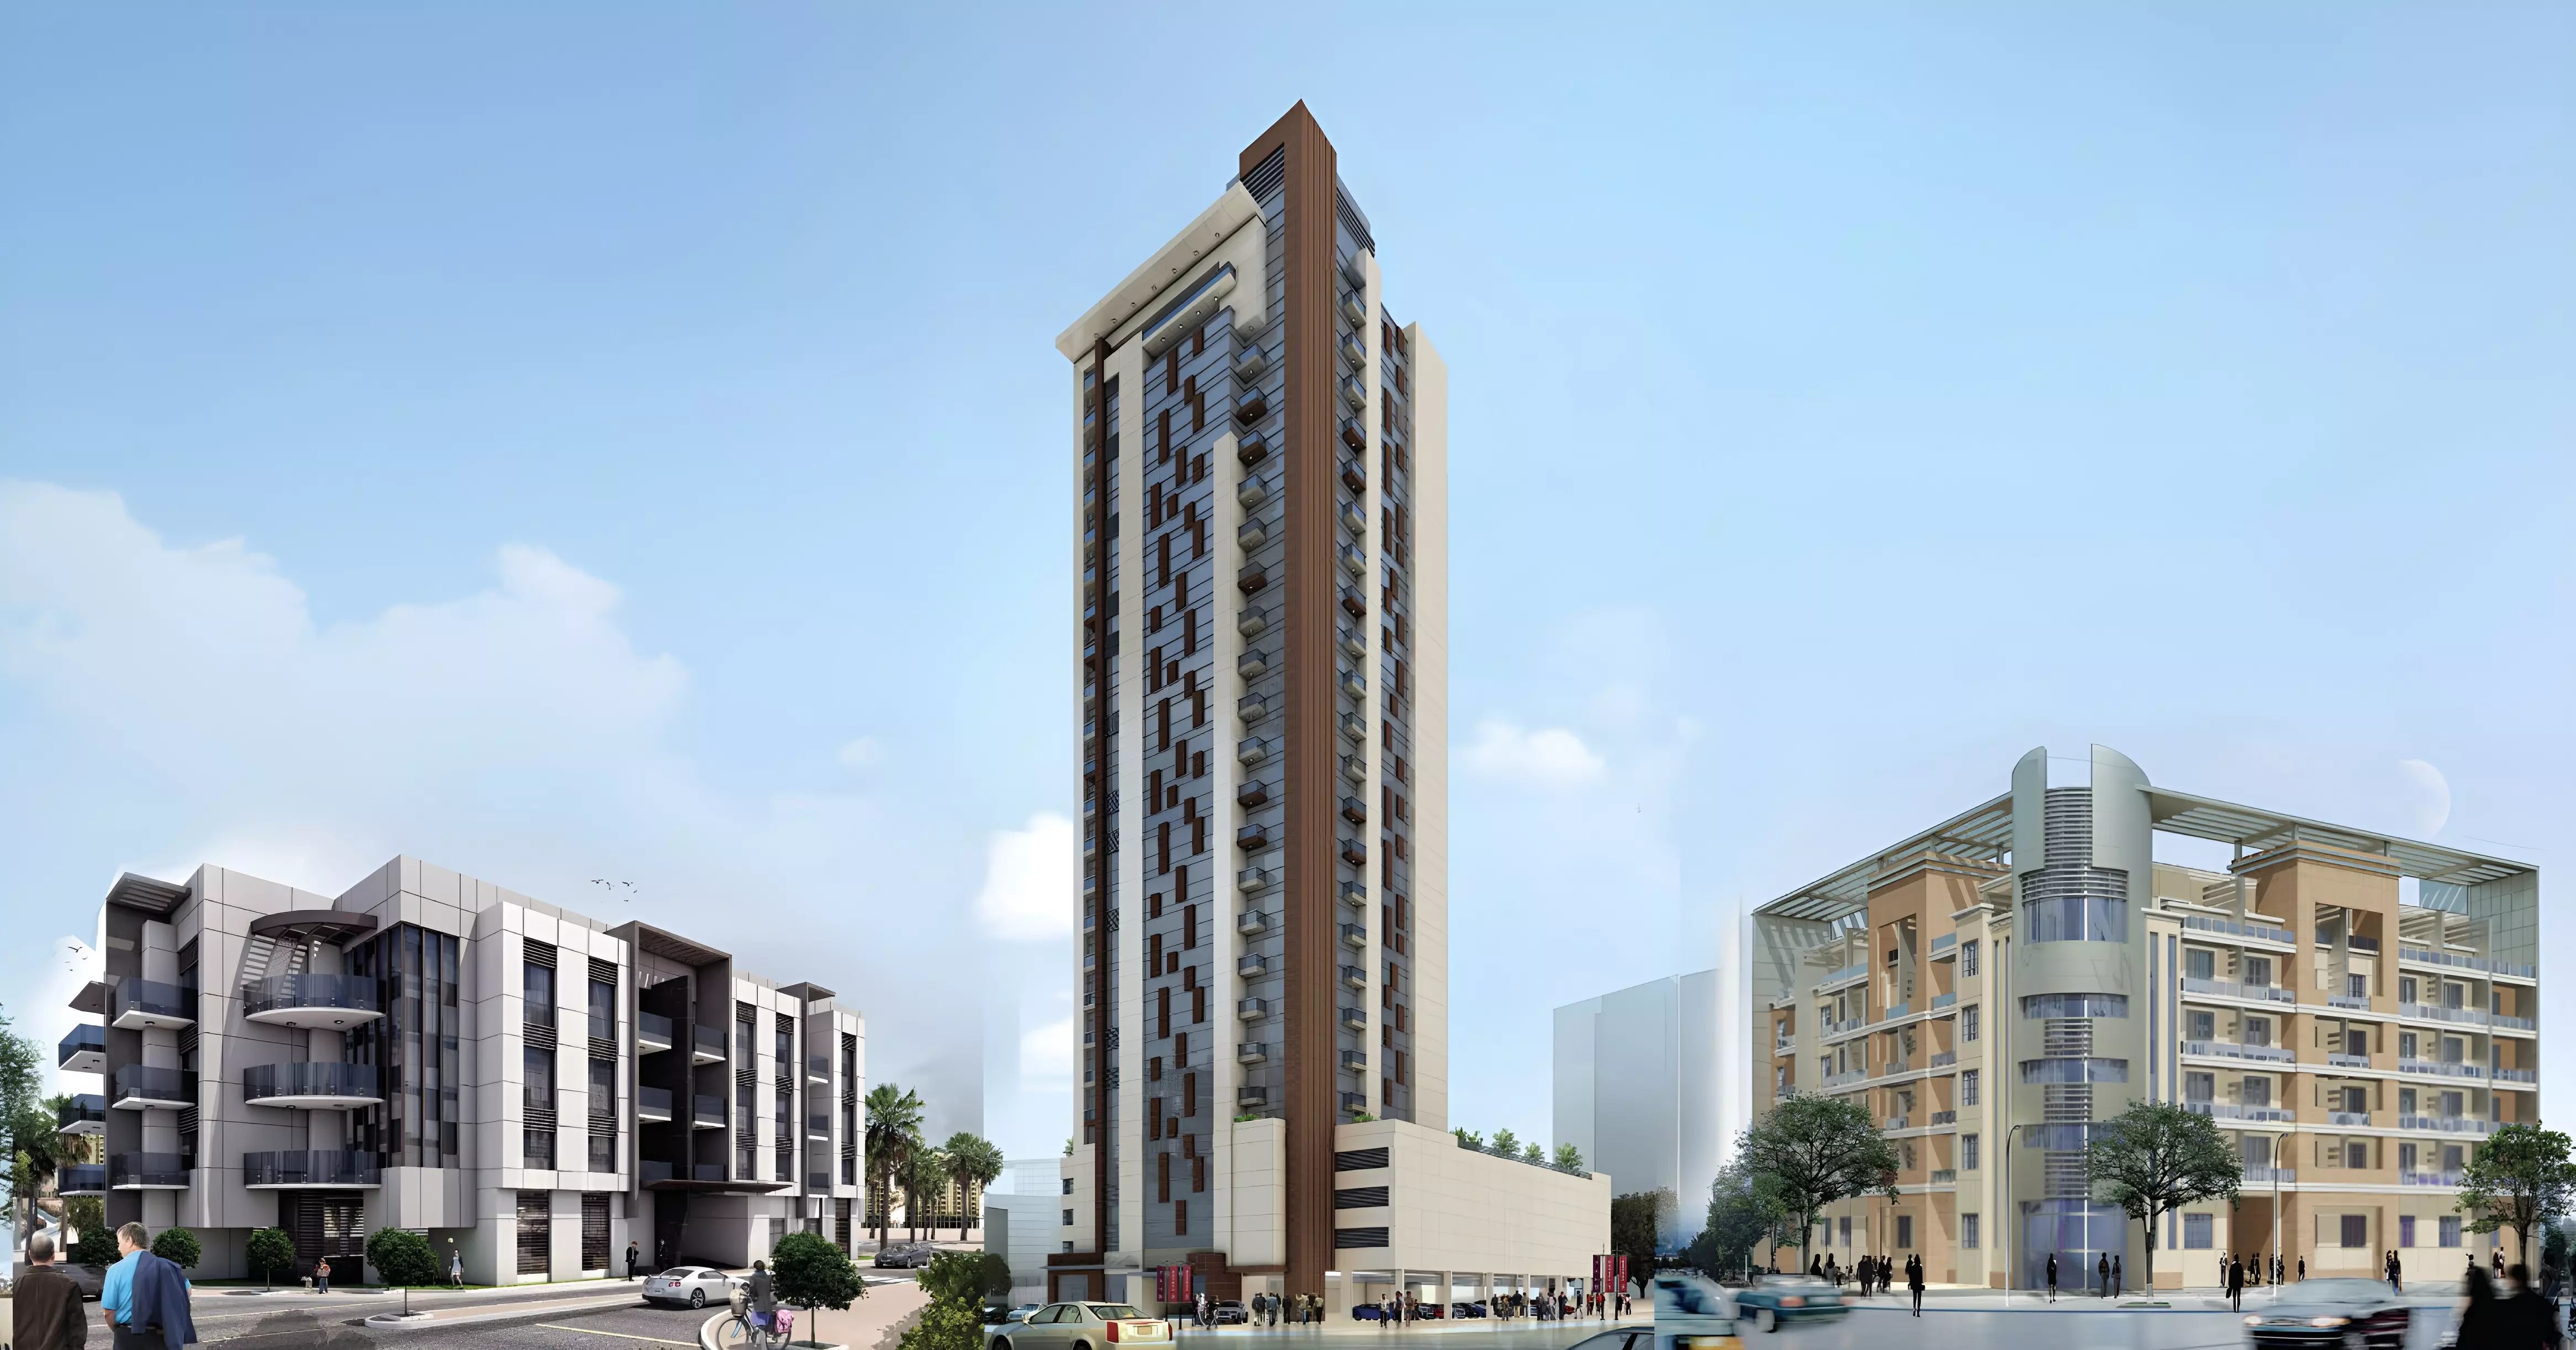
سمحة للتطوير
From
AED 620,000
Handover
Q4 2026
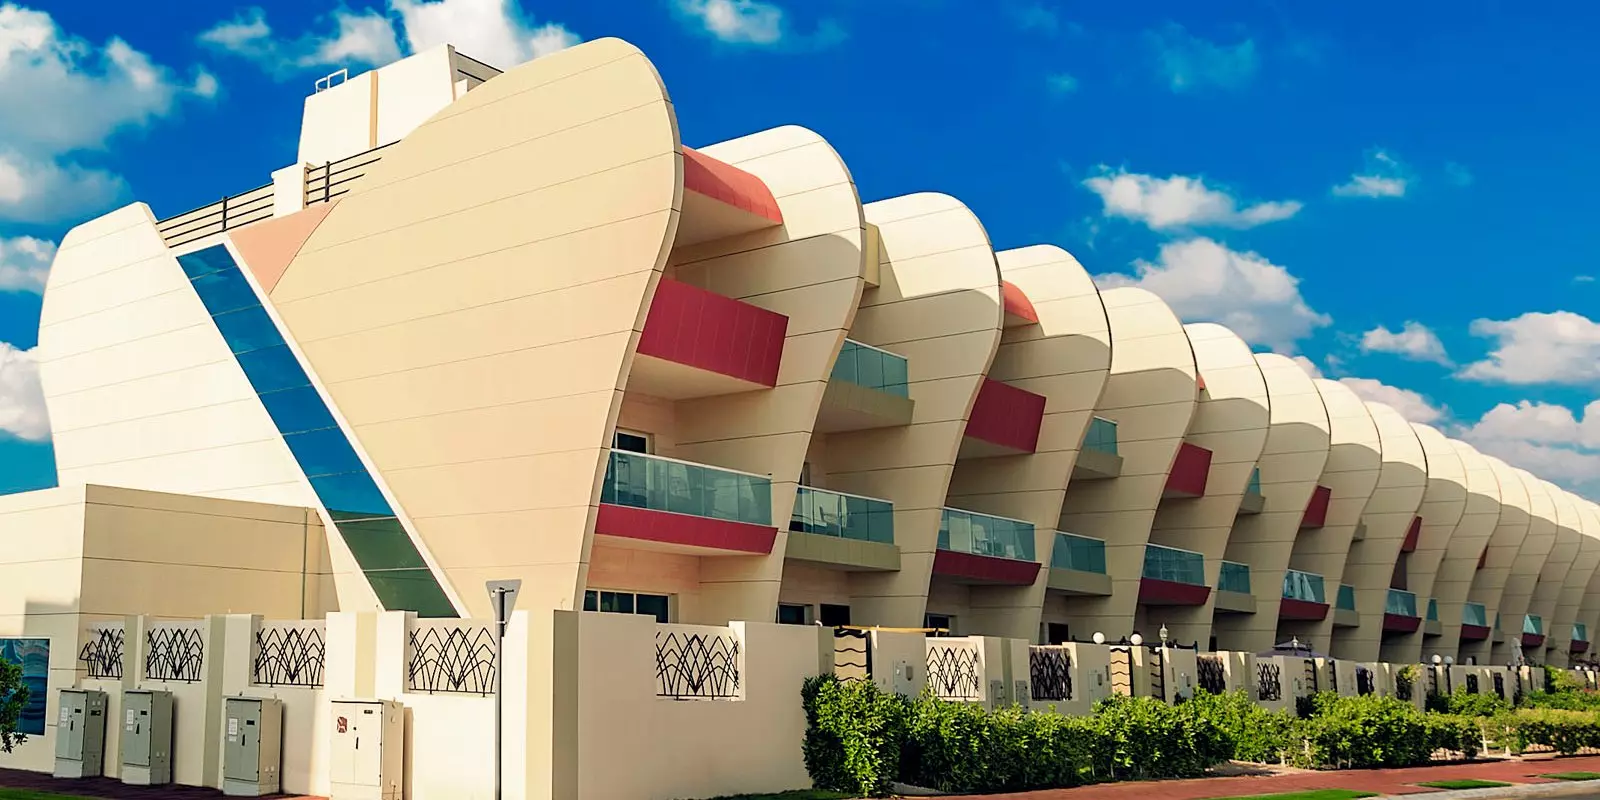
ويستار العقارية
From
AED 2.4 مليون
Handover
Q1 2023
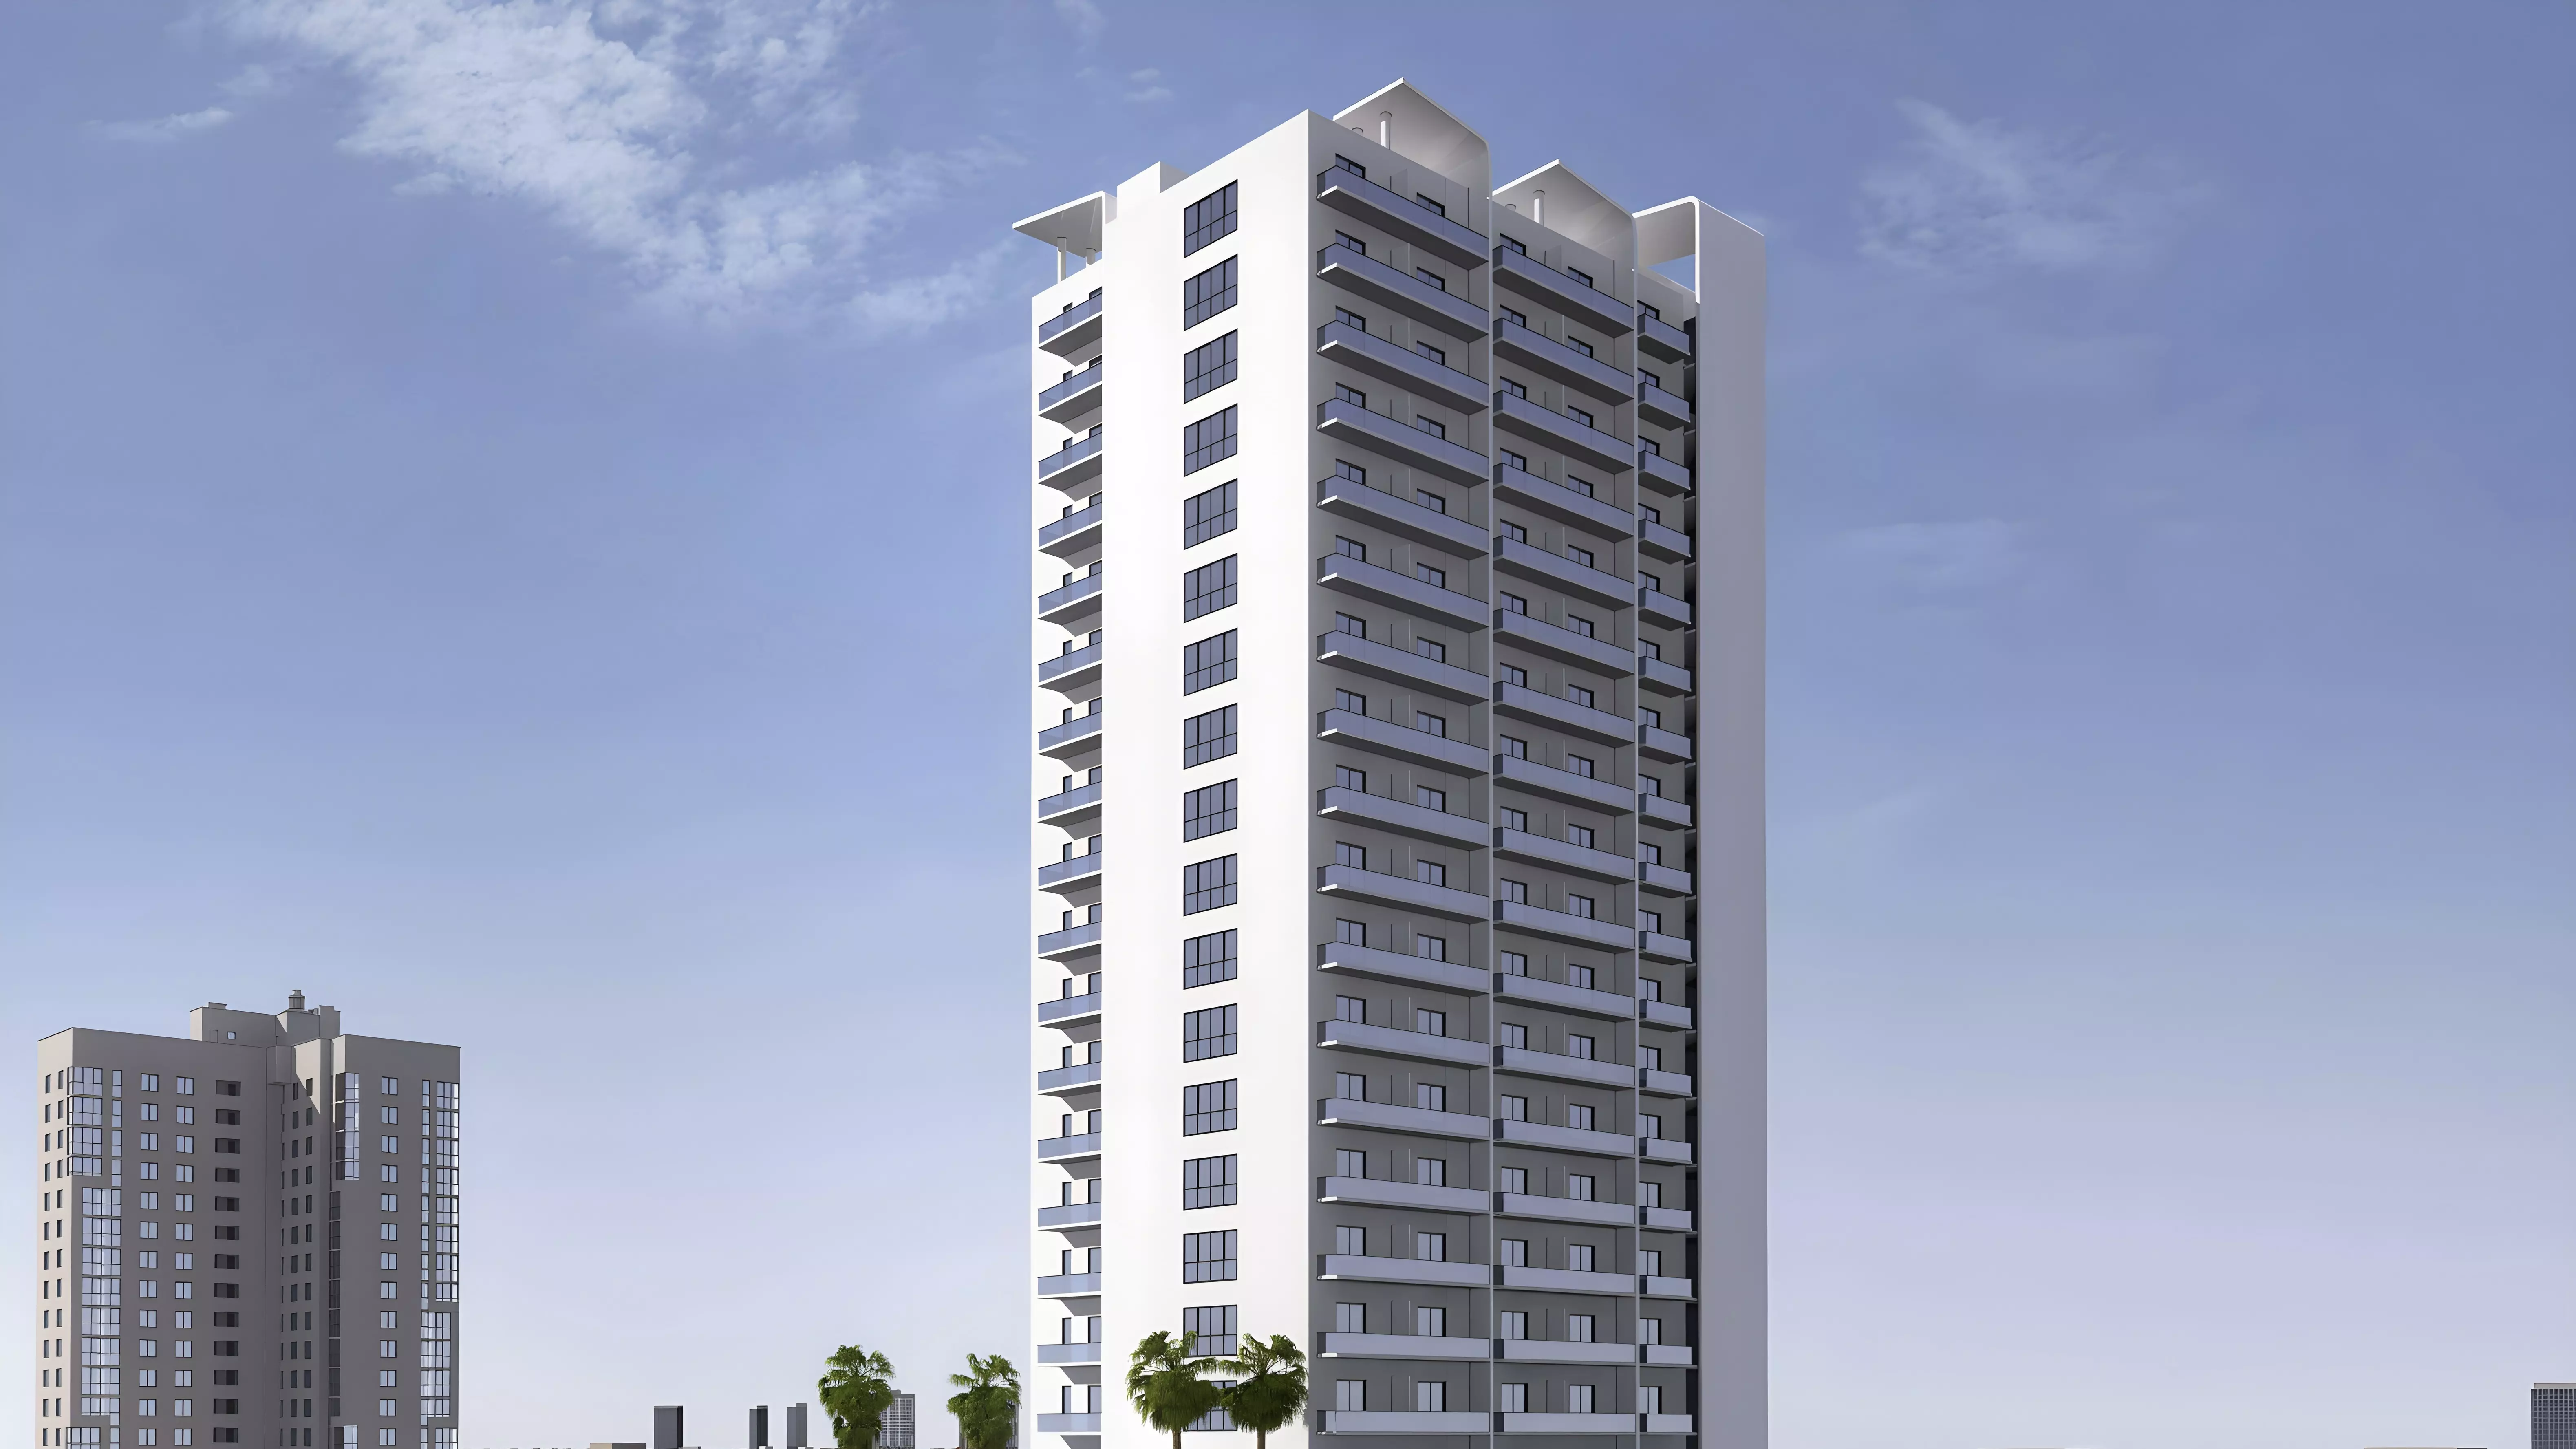
ميتريكال للتطوير
From
AED 652,777
Handover
Q4 2028
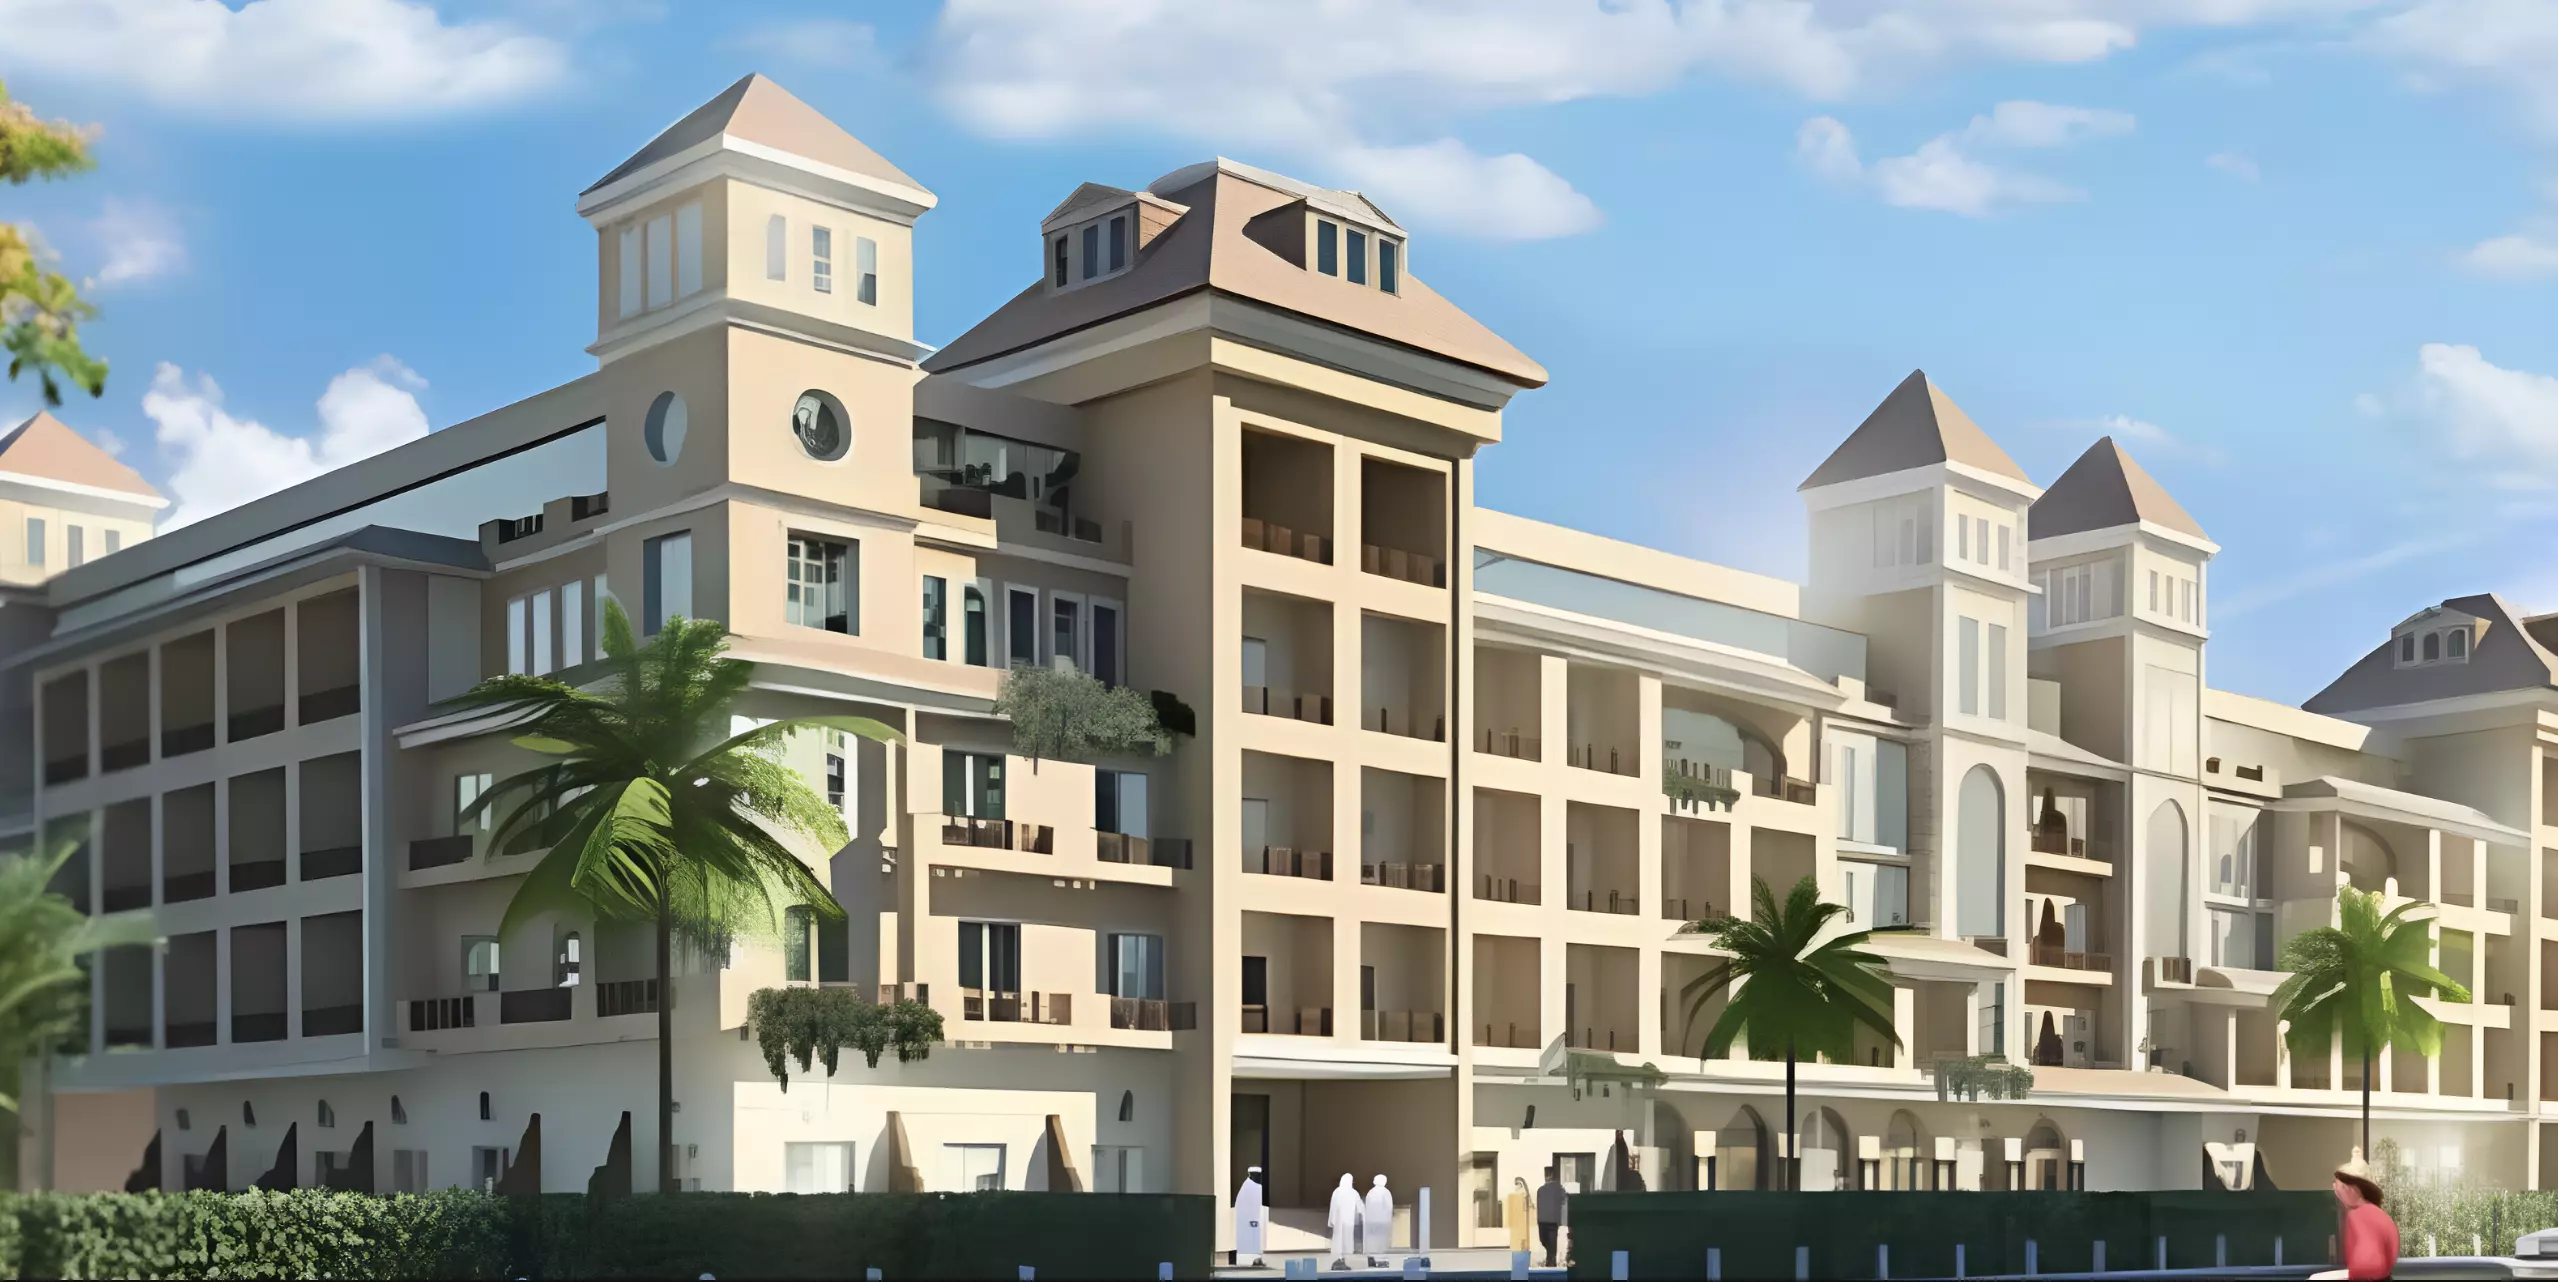
داماك العقارية
From
AED 525,000
Handover
Q2 2015
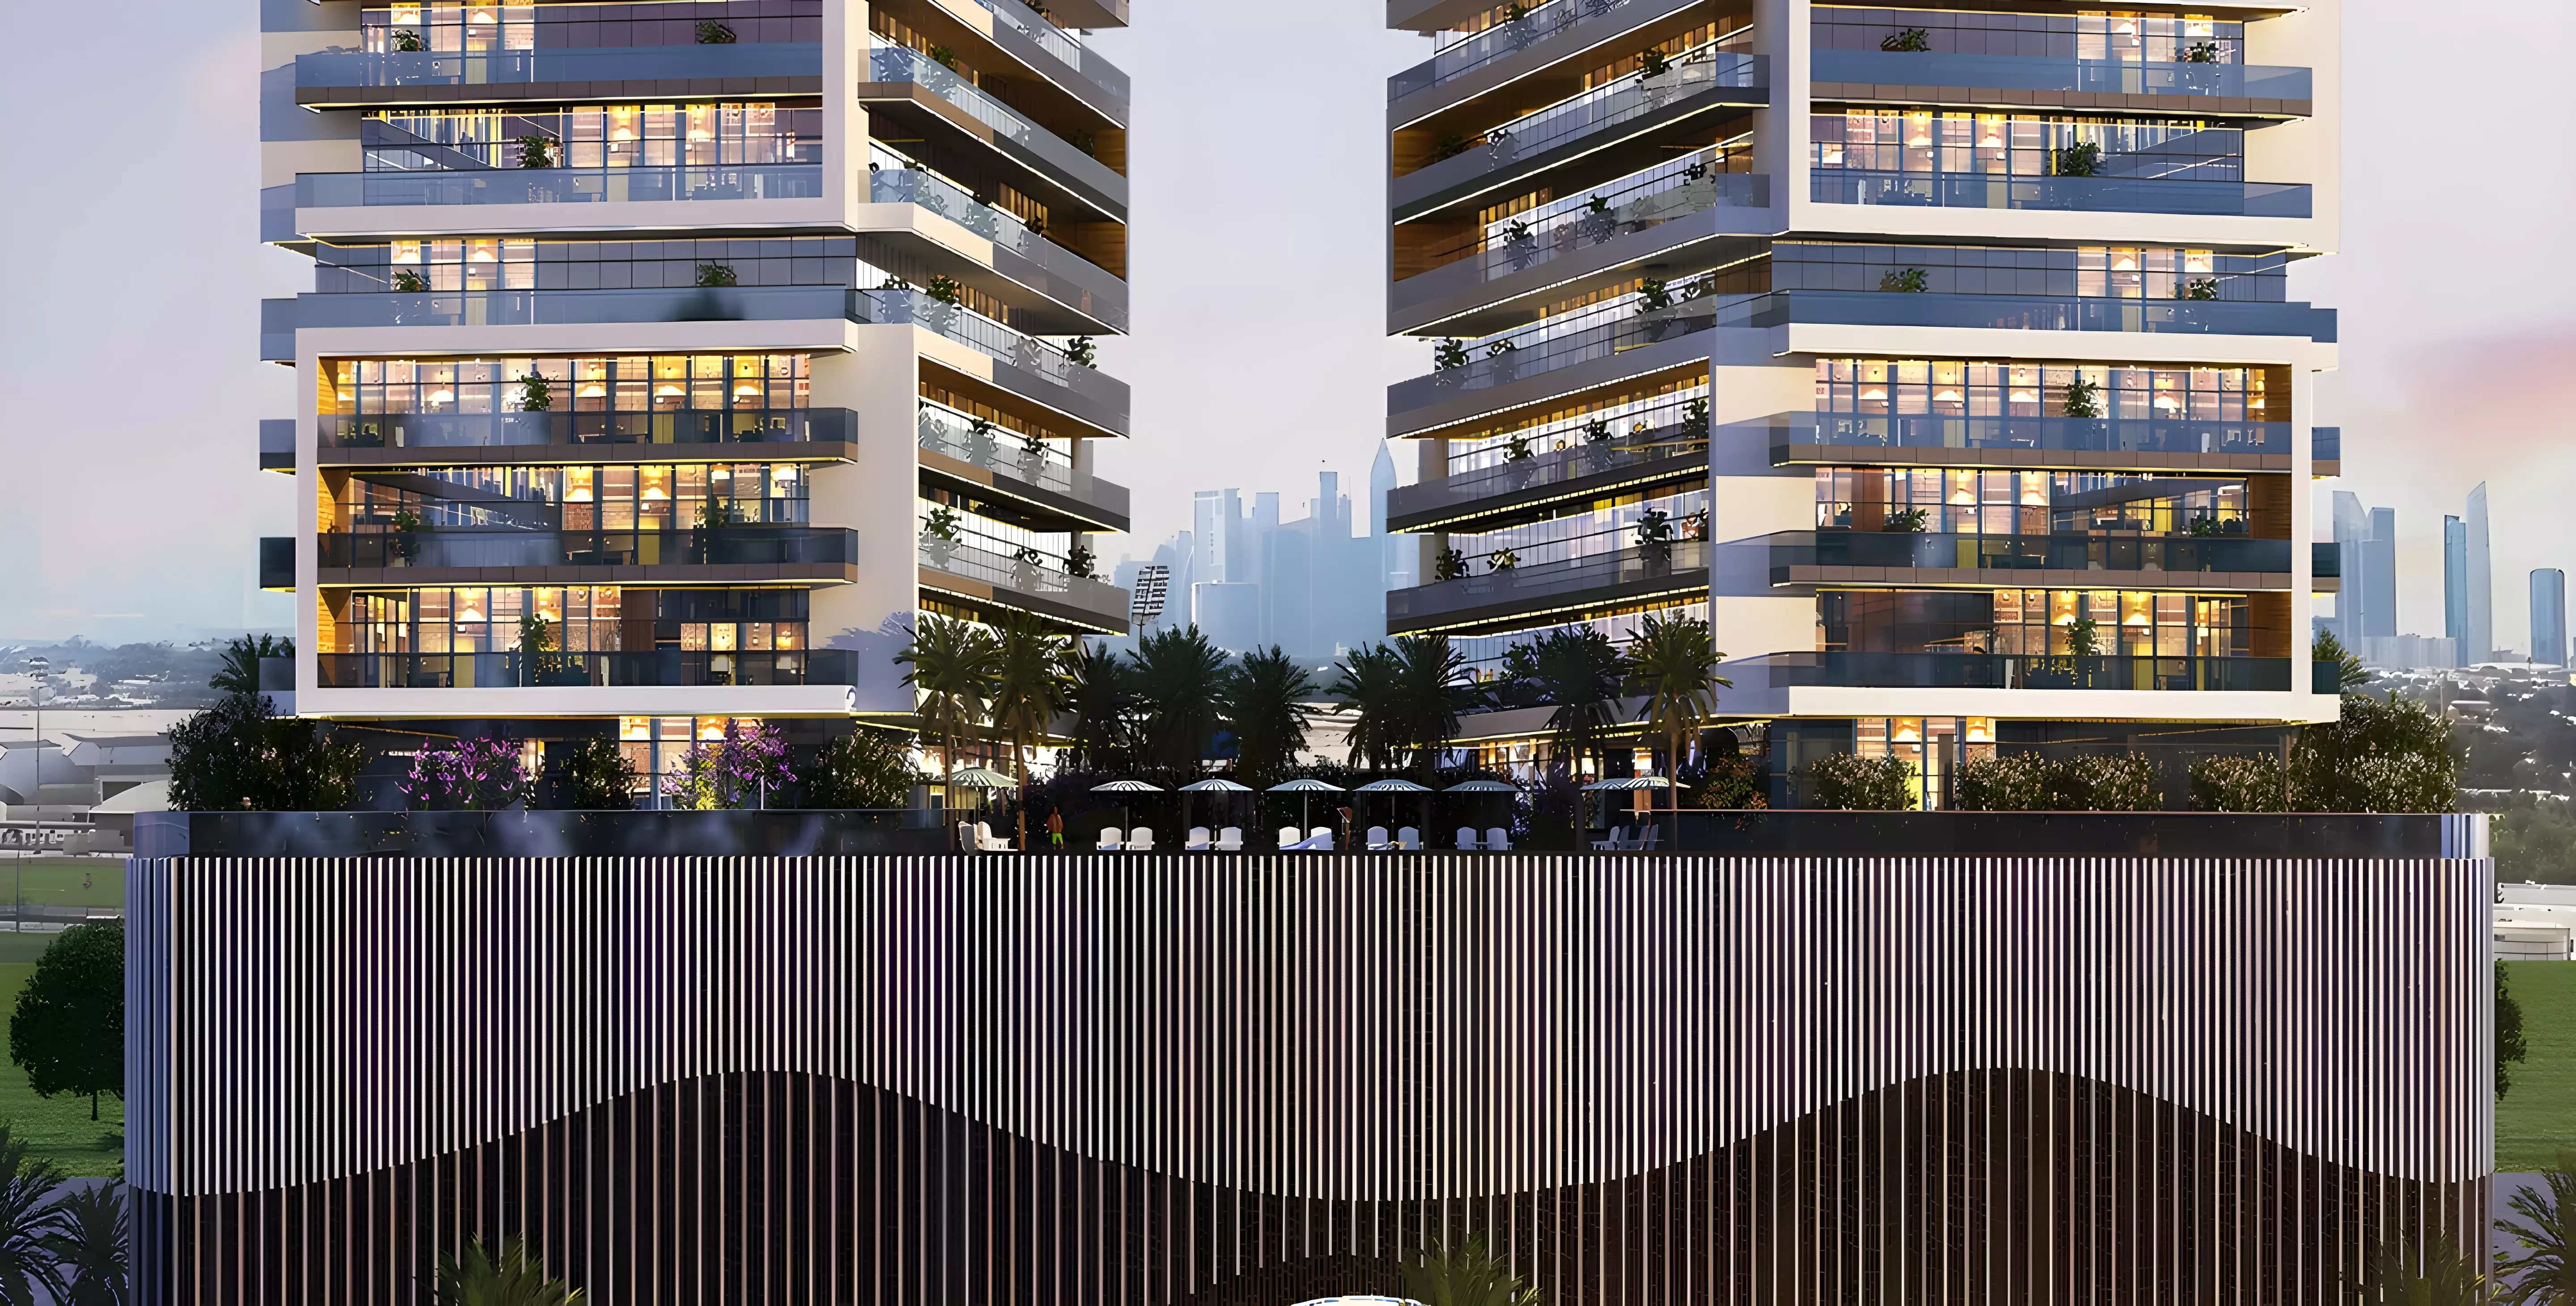
Developer TBA
From
AED 960,000
Handover
Q1 2028
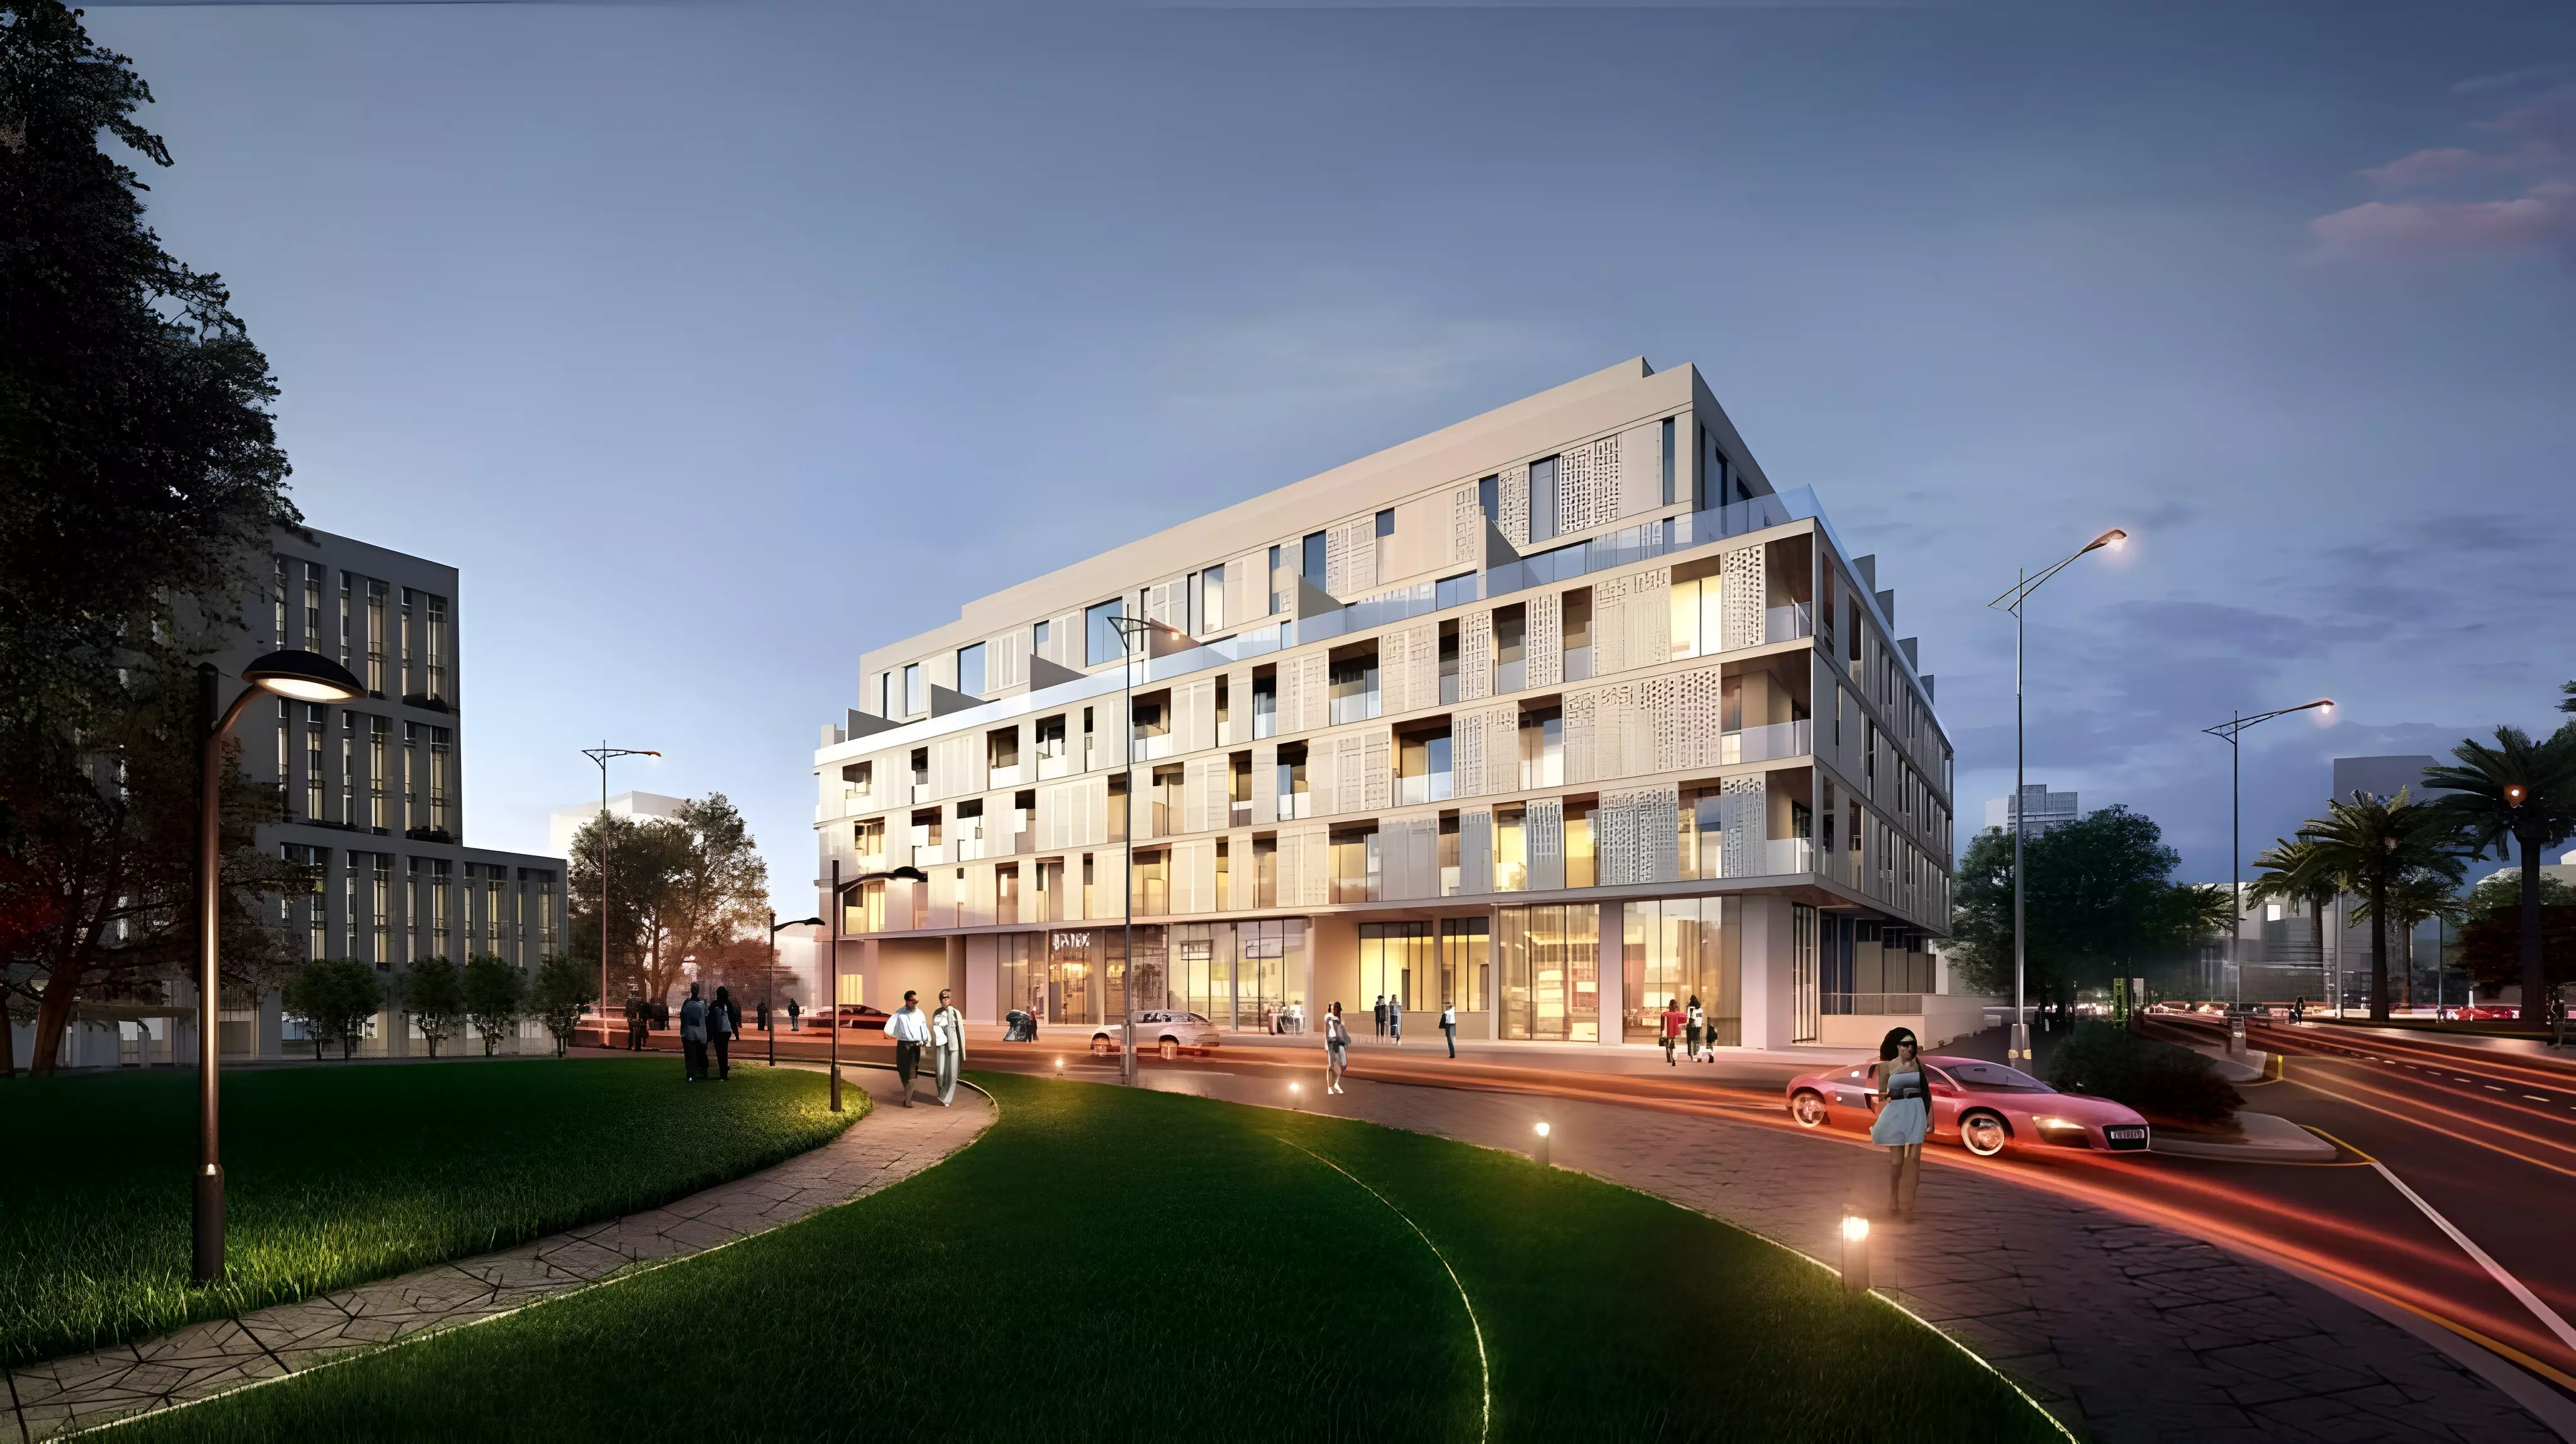
Developer TBA
From
AED 495,000
Handover
Q4 2025
Source policy
Data first, no mock scores
Market figures are sourced from DLD-backed rollups and public transaction endpoints. Project cards use AiGentsRealty catalog records. When the database does not expose a value, the page shows an unavailable state instead of filling the gap with a placeholder.